Understanding Incrementality Variability: Why the Median Isn't the Full Story

When analyzing incrementality test results across different advertising channels, most brands focus exclusively on one metric: median incremental ROAS.
Which channel delivers the highest return? That's the question everyone wants answered.
But there's a second-order question that's equally important and often completely overlooked: How predictable are those results?
Let me explain why variability matters just as much as median performance when evaluating your advertising channels.
👉🏼 [YouTube Explainer] - Part 2: Stella's Incrementality Reports' Replicability
The Missing Metric: Interquartile Range (IQR)
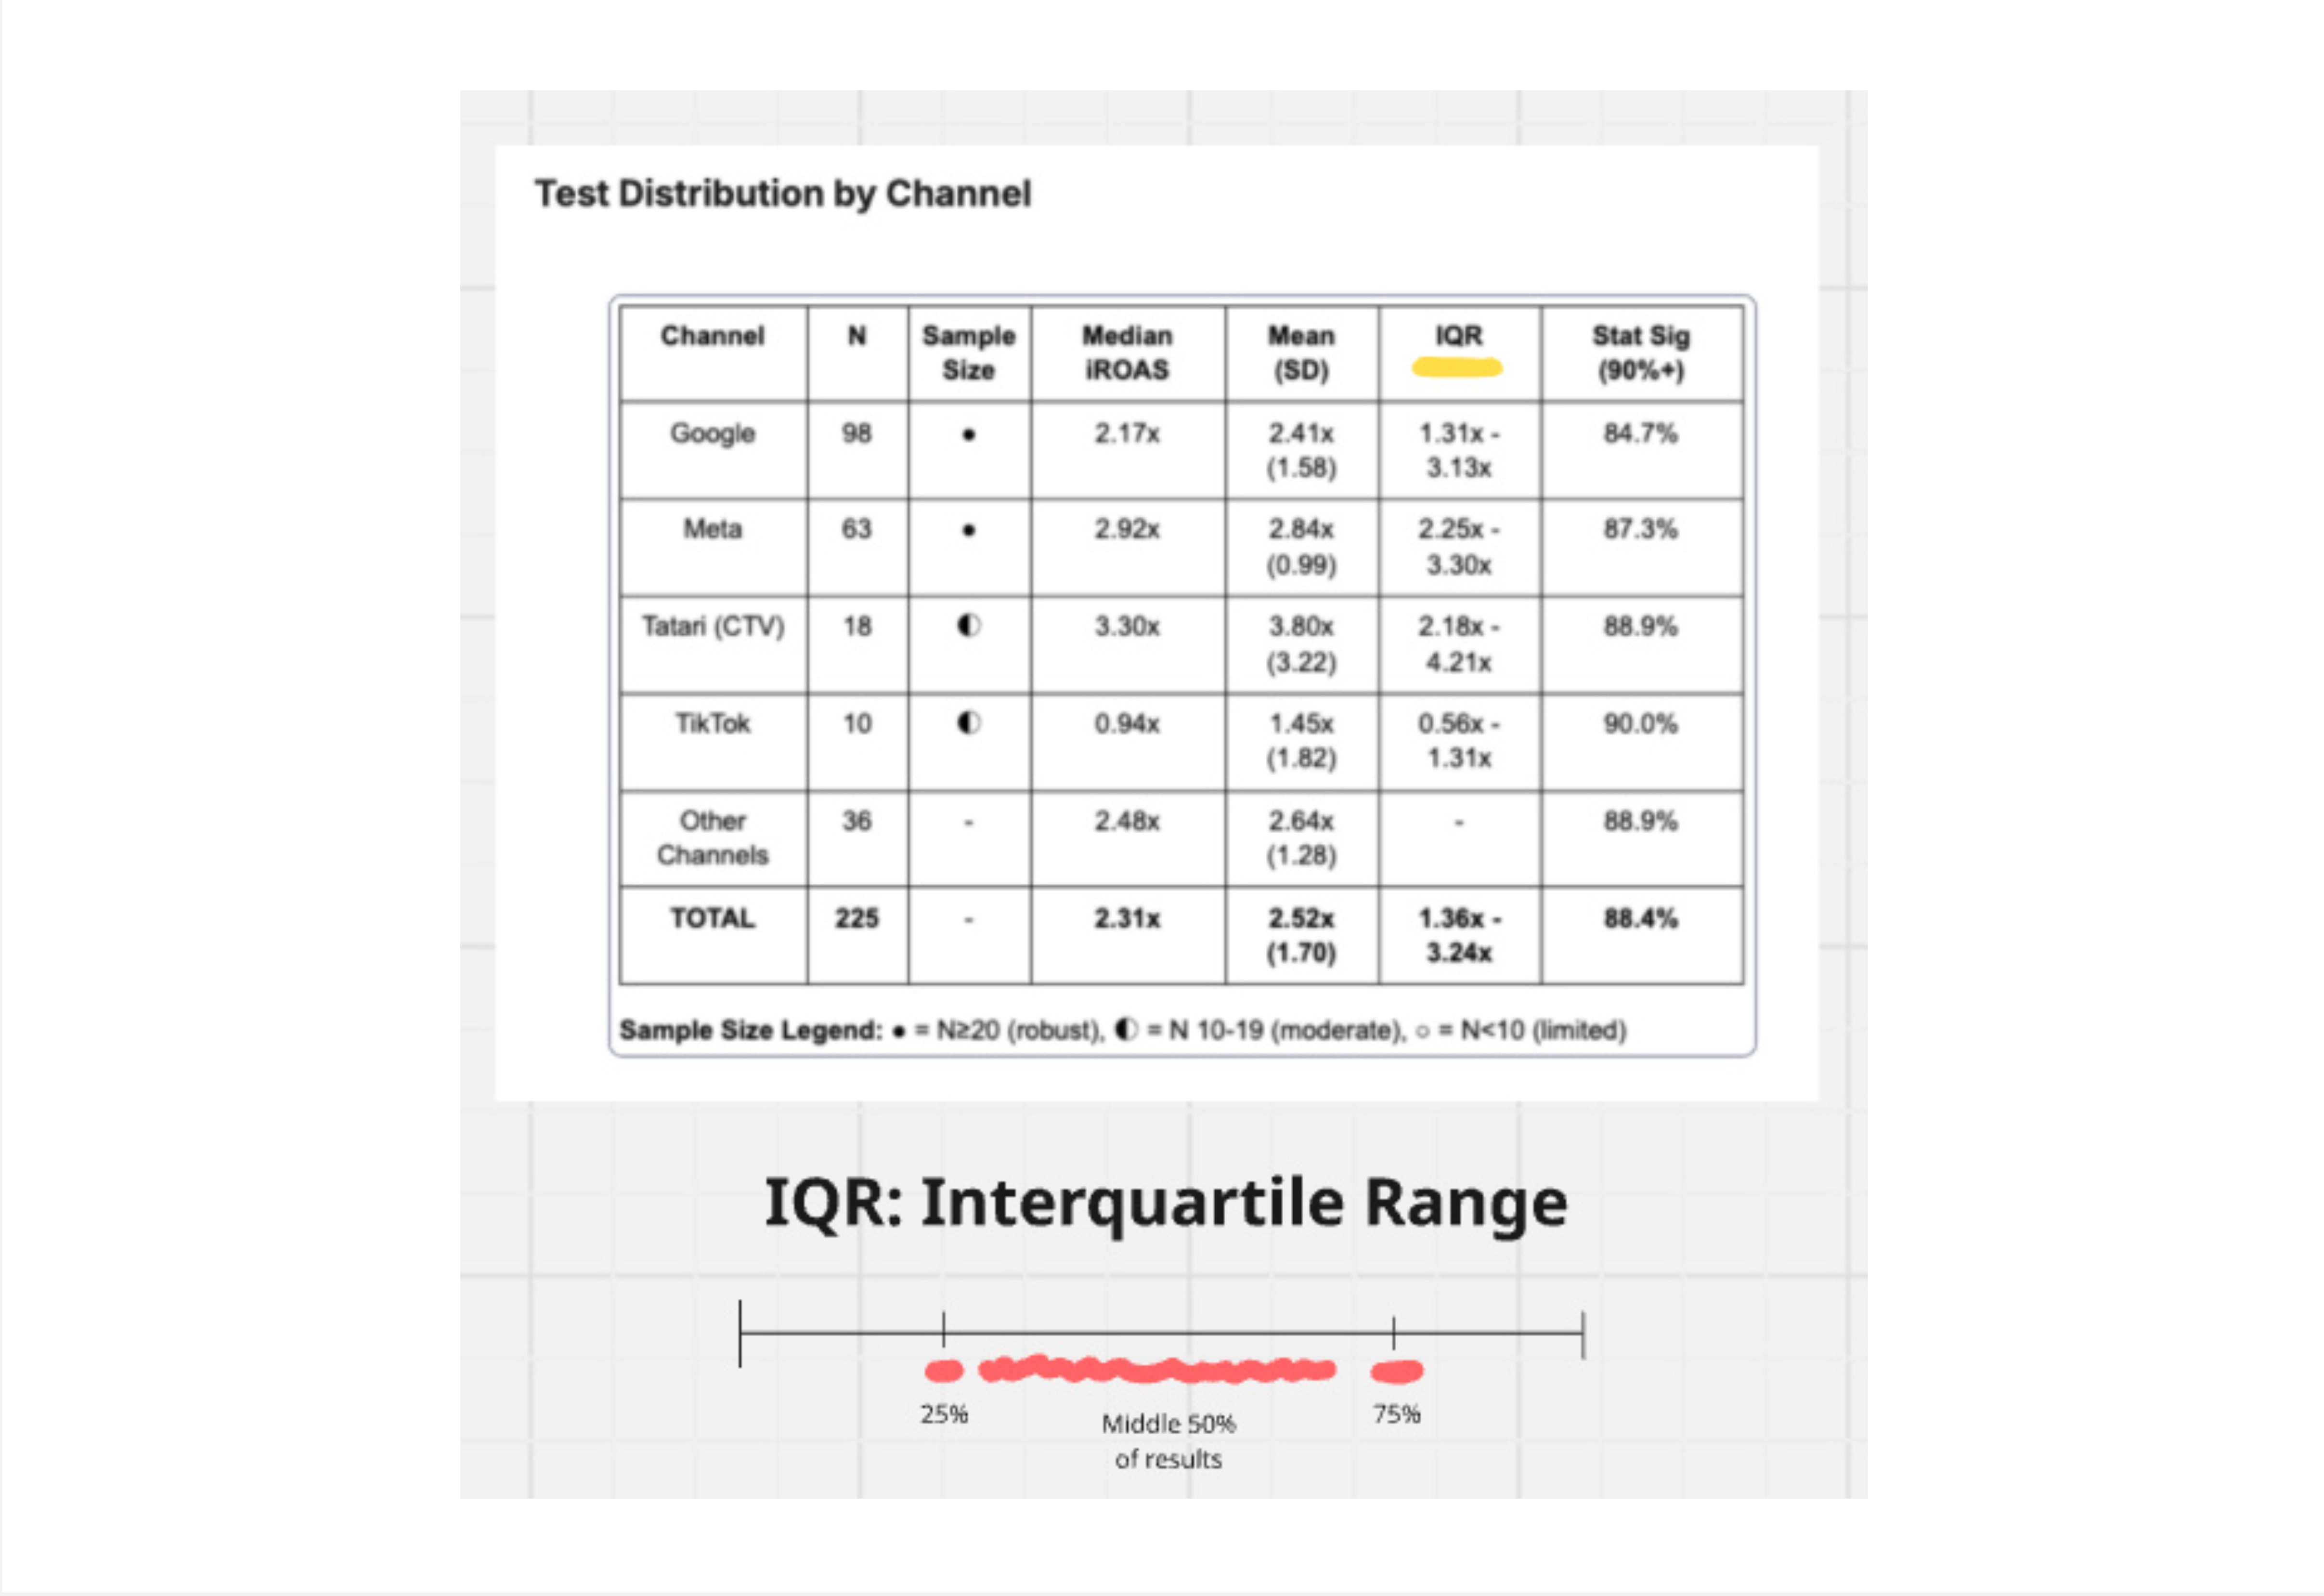
When you're looking at incrementality reports—whether from Stella or another platform—pay close attention to the IQR column. This metric tells you something critically important that the median alone cannot.
IQR measures the interquartile range. Out of all the results in the sample size, it takes the spread between the 25th percentile result and the 75th percentile result. This gives you a read of the middle 50% of results while filtering out the outliers on either side.
Why does this matter?
IQR tells you about the predictability and replicability of results by channel. It's the difference between knowing a channel can deliver great results versus knowing it consistently delivers results close to that median.
Real Example: Meta vs. Google vs. Connected TV
Let's walk through what this looks like in practice using actual incrementality data.
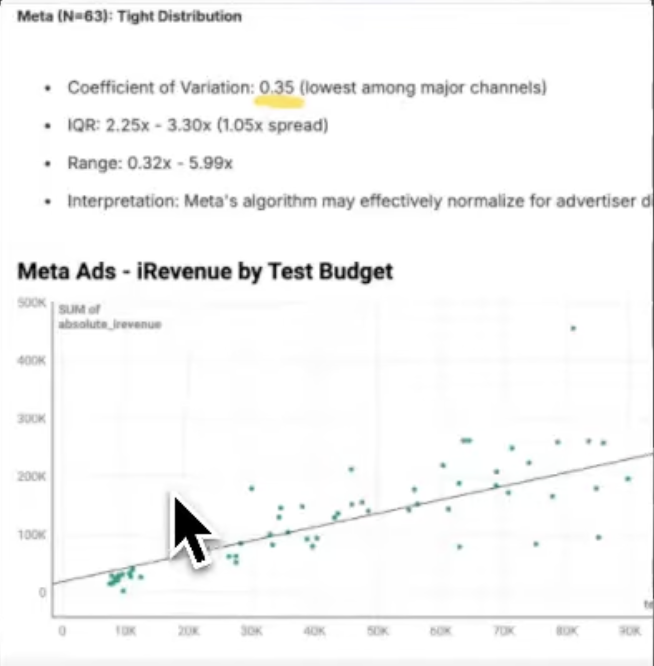
Meta: The Consistency Winner
When you plot Meta's incrementality test results—with spend on the x-axis and revenue generated on the y-axis—you see a consolidation of results around the line of best fit.
Meta shows the lowest coefficient of variation among all channels in the report. This means the results are quite consolidated and clustered around that line of best fit. There's a lower level of variability in the incremental return on ad spend.
Google Ads: Increased Scatter
Google Ads tells a different story. The coefficient of variation is close to double that of Meta. Especially at higher spend levels, you start to see more of a scatter plot of incremental ROAS results.
This means the predictability—particularly at higher spend levels—starts to drop for Google Ads. You might get great results, but you might also see significant variance from the median.

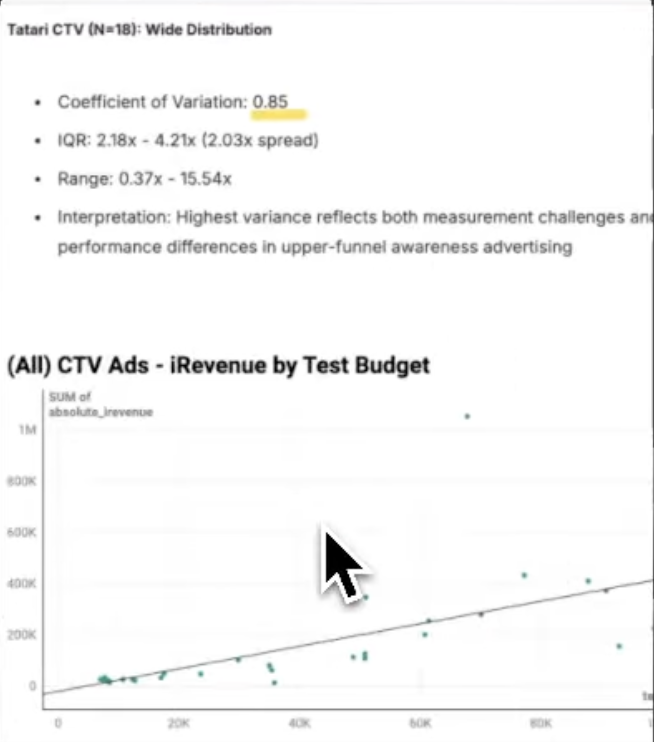
Connected TV: High Returns, High Variability
Connected TV had the highest coefficient of variation and the highest IQR in the sample set of results. This is where things get interesting.
The Predictability Problem
Here's why this matters in practice.
When you look at median incremental ROAS broken down by channel, it's exciting to see Connected TV have the highest median. That obviously presents itself as an opportunity—who wouldn't want to invest in the channel with the best returns?
But then we have this second-order question about replicability and predictability of the results.
The reality: Meta actually produced results that were most reliably close to the median across all the different tests.
This means if you were to run a Meta incrementality test for your brand, the likelihood that your incrementality result lands close to the 2.92x median iROAS for Meta is higher than if you were to run an incrementality test for Connected TV.
For Connected TV, even with a higher median, the chances that you would land closer to the median are actually lower because you would expect a higher spread of results.
What This Means for Your Media Planning
Understanding variability changes how you should think about channel investment.
High Median + Low Variability (Meta):
- More predictable outcomes
- Easier to forecast performance
- Lower risk when scaling spend
- Results cluster consistently around expectations
High Median + High Variability (Connected TV):
- Potential for exceptional results
- Also potential for disappointing results
- Harder to forecast performance
- Higher risk profile when scaling
Moderate Median + Moderate Variability (Google Ads):
- Somewhere in between
- Variability increases at higher spend levels
- Requires careful monitoring as you scale
How to Use This Information
When evaluating incrementality reports, ask yourself two questions:
- What's the median incremental ROAS? (This tells you the central tendency)
- What's the IQR and coefficient of variation? (This tells you how consistent that performance is)
A channel with a slightly lower median but much tighter clustering around that median might actually be the better investment for consistent, predictable growth. Meanwhile, a channel with a higher median but wild variability might be worth testing with a smaller portion of your budget to see where your brand lands in that distribution.
The Bottom Line
Keep in mind when you're looking at incrementality reports: the idea of IQR and the coefficient of variation is telling you something about the spread of results.
Don't just chase the highest median ROAS. Consider whether you want:
- Consistency - Knowing you'll likely land near the median
- Upside potential - Accepting higher variability for a chance at exceptional results
- A balanced approach - Mixing channels based on their risk/return profiles
The brands that understand both central tendency AND variability in their incrementality data make smarter, more informed channel allocation decisions.
Median performance tells you what's possible. Variability tells you what's probable.
Want help interpreting your incrementality test results or understanding which channels offer the best risk-adjusted returns for your brand? Send us a message.
Check out our other articles.


Get started today.
We only work with a handful of clients per year. If you're interested, book a discovery with our founder to see if this is a good fit.
What we do
Grow & scale your paid media program with a boutique team of eCommerce advertising pros.
Case studies
See what we've done for other brands and how we can help you. Read their stories.