Abridged: calculating SKU-specific customer acquisition costs in DTC

Understanding which products in your catalog are truly profitable can make or break your advertising strategy. Most e-commerce brands look at overall ROAS or blended metrics, but the real insights come from diving deeper into SKU-specific performance.
Today I want to walk you through exactly how to calculate customer acquisition cost (CAC) at the individual product level - plus how to determine SKU-specific contribution margins.
Why SKU-Specific CAC Matters
Before we dive into the methodology, it's worth understanding why this matters. When you only look at blended metrics across your entire catalog, you might be:
- Over-investing in products that seem profitable but actually aren't
- Under-investing in your true profit drivers
- Missing opportunities to optimize your product mix
- Making inventory decisions based on incomplete data
SKU-level analysis gives you the granular insights needed to make smarter advertising and business decisions.
Calculating SKU-Specific Customer Acquisition Cost
Here's the step-by-step process:
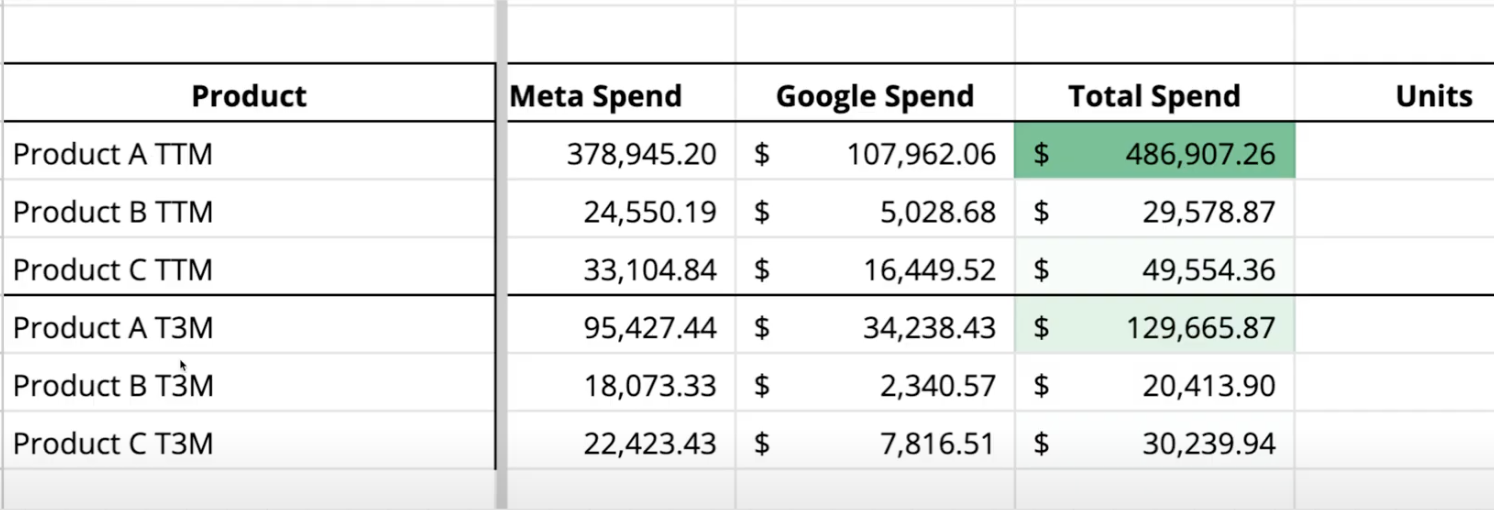
Step 1: Gather All Product-Specific Ad Spend
First, you need to collect all advertising spend for your target product (let's call it Product A) across every platform where you're advertising:
- Meta (Facebook & Instagram)
- TikTok
- YouTube
- Snapchat
- Google Ads (non-branded keywords)
- Google Shopping (Product Listing Ads)
- Microsoft Ads
- Any other paid channels
Critical requirement: You can only do this effectively if you have strong naming conventions in your ad accounts. You need to be able to identify at the ad level which creative features which product.
Step 2: Include All Relevant Search Spend
Don't forget to add:
- All non-branded keyword spend that drives sales for Product A
- All Google Shopping spend specifically for Product A
Step 3: Calculate New Customer Purchases
Now divide your total Product A ad spend by the number of new customer carts where Product A was present.
Important note: Include carts where customers bought Product A plus additional products. These still count as new customer acquisitions driven by your Product A advertising.
Step 4: Ensure Consistent Time Windows
This is crucial - make sure you're pulling data from identical time periods across all platforms. Whether you choose:
- Trailing 90 days
- Year to date
- Trailing 12 months
The time window must be consistent across your social platforms, Google Ads, Microsoft Ads, and your Shopify data.

Taking It Further: SKU-Specific Contribution Margin
Once you have your CAC calculation down, you can take the analysis one step further to understand true profitability at the product level.
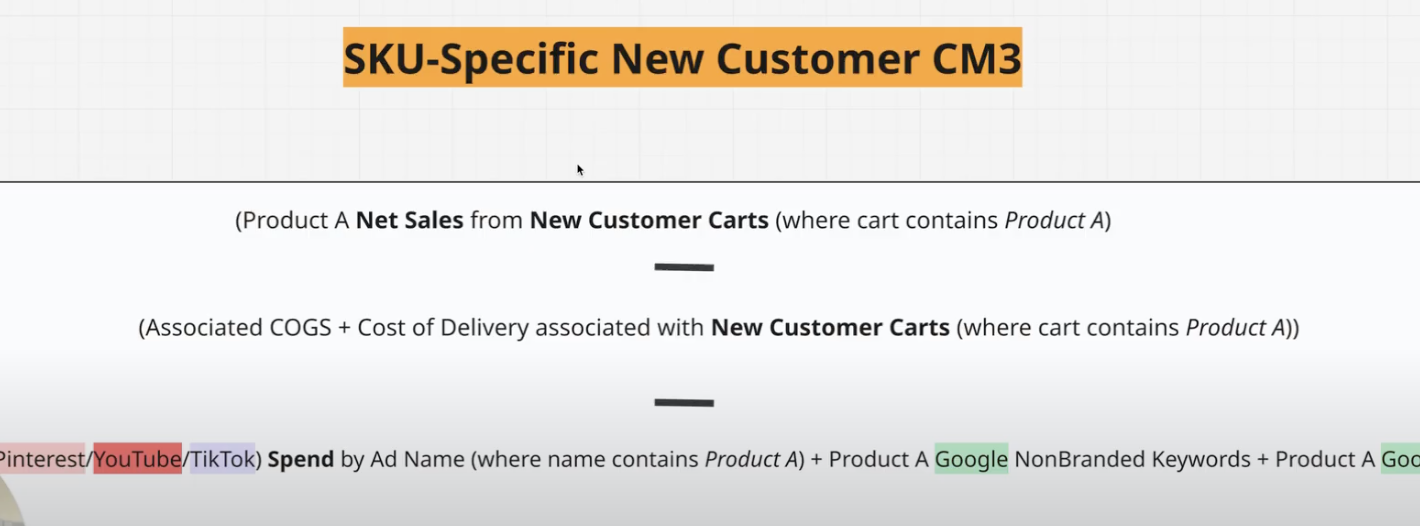
The Calculation:
Net Sales (from new customer carts containing Product A) Minus: Product A cost of goods sold Minus: Delivery costs for those new customer carts
Minus: All Product A advertising spend across platforms Equals: SKU-Specific New Customer Contribution Margin
Turning Data Into Actionable Insights
Once you've run these calculations, create a comprehensive view by:
- Running analysis for multiple products in your catalog
- Comparing different timeframes (12-month vs. 3-month trailing)
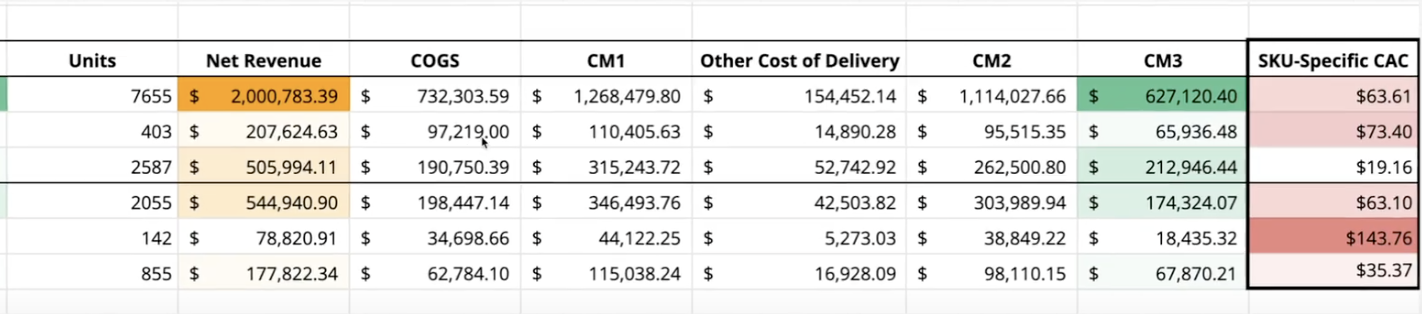
- Creating visualization tables that show:
- SKU-specific CAC
- SKU-specific contribution margins
- Performance across different time periods
What This Analysis Reveals
This level of granular analysis will help you:
- Identify your true profit drivers - products that generate strong contribution margins with reasonable CAC
- Spot wasted spend - products that look good on paper but destroy profitability
- Find new opportunities - underinvested products with strong unit economics
- Make smarter inventory decisions based on true profitability, not just sales volume
- Optimize your advertising mix by shifting budget toward your most profitable SKUs
The Bottom Line
Most e-commerce brands are flying blind when it comes to product-level profitability. They're optimizing for vanity metrics instead of the numbers that actually matter for business growth.
By implementing SKU-specific CAC and contribution margin analysis, you'll have the insights needed to:
- Allocate your advertising budget more effectively
- Focus your creative testing on products that actually drive profit
- Make inventory decisions that improve your bottom line
- Scale your business more profitably
This analysis takes some work to set up initially, but the directional insights it provides are invaluable for any serious e-commerce operation.
Need help implementing this analysis for your brand? At Artifex Digital, we help e-commerce businesses optimize their advertising performance with detailed financial analysis. Feel free to reach out if you'd like assistance setting up SKU-specific tracking and reporting.
Check out our other articles.

Get started today.
We only work with a handful of clients per year. If you're interested, book a discovery with our founder to see if this is a good fit.
What we do
Grow & scale your paid media program with a boutique team of eCommerce advertising pros.
Case studies
See what we've done for other brands and how we can help you. Read their stories.