How to forecast & financially plan for DTC brands

Running a direct-to-consumer brand without a solid financial forecast is like driving blindfolded. You might be moving forward, but you have no idea if you're headed toward success or disaster.
After managing over $50 million in ad spend across our DTC clients, we've learned that the brands that scale profitably all share one thing in common: they forecast religiously and measure themselves against those forecasts.
Here's exactly how we approach forecasting and financial planning for the DTC brands we work with.
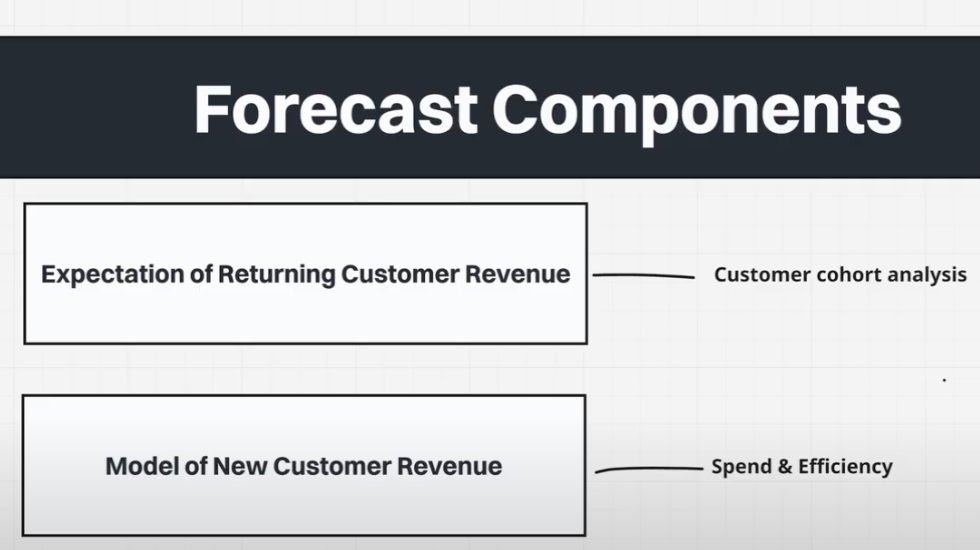
The Two-Layer Forecasting Framework
When forecasting for a DTC brand, there are two critical layers that require completely different methodologies:
Layer 1: Returning Customer Revenue This is your foundation. It's built on cohort analysis—understanding what customers acquired in the past are likely to purchase in the future based on their historical behavior. The longer your brand has been around, the more accurate this forecast becomes.
Layer 2: New Customer Revenue This layer is more dynamic and depends heavily on your media spend, the efficiency of that spend, and how well your acquisition channels are performing.
Together, these two layers give you a complete picture of your revenue expectations.
Building Layer 1: The Returning Customer Forecast
We start by diving into cohort analysis using Klar, our business analytics tool of choice. Here's what we're looking at:
For each cohort of customers acquired in a specific month, we track their contribution margin growth over time. For example, if you acquired 335 customers in January 2023 with an average first purchase contribution margin of $240, we then track how much additional contribution margin those same customers generate in months 1, 2, 3, and beyond.
This shows us the incremental value of repeat purchases from existing customer cohorts. When you export this data and plug it into your forecasting model, you've built the foundation—the expected recurring revenue from your existing customer base.

Understanding Your Margin Profile
Before we can build Layer 2, we need to understand your business's margin structure. This is where the three levels of contribution margin come in:
Contribution Margin 1 (CM1) = Net Sales - Cost of Goods Sold This tells you how much money you have left after a sale to cover marketing, payment, and delivery costs.
Contribution Margin 2 (CM2) = CM1 - Logistics Costs - Transaction Fees This is how much money you made from the sale after all fulfillment costs are paid. This number determines what you have left to cover marketing and OpEx.
Contribution Margin 3 (CM3) = CM2 - Ad Spend This is your profit after paying for customer acquisition—essentially what's left to cover your fixed costs and OpEx.
Pull these percentages from your analytics platform. For our example brand, we're looking at 65% CM1 and 48% CM2.
📖 [Similar read] - What is Contribution Margin?
Accounting for Seasonality
Every DTC brand has seasonal patterns. Understanding yours is crucial for accurate forecasting.
Look at your historical data to identify your seasonal curve. Calculate each month's performance relative to your average. For example, if January typically performs 44% below your average month, that's your seasonal effect. If November (hello, Black Friday) performs 60% above average, factor that in.
This seasonal multiplier will dramatically improve your forecast accuracy and help you plan media spend appropriately throughout the year.

Building Layer 2: New Customer Acquisition Forecast
Now we get to the exciting part—modeling new customer revenue. This requires two inputs:
1. Customer Acquisition Cost (CAC) What does it cost you to acquire a customer? For this example, let's say historical data shows $120 per customer.
Important caveat: CAC is never perfectly flat. As you scale spend, efficiency typically decreases. Your model should account for this reality. If you plan to increase spend by 50%, your CAC might increase by 20-30%.
2. Media Spend Plan Start with your average monthly spend from the previous year. Then apply your seasonal multiplier to create a month-by-month spend plan.
If you spent an average of $100,000 monthly last year, and January runs 44% below average, your January spend plan would be $55,000. For November with its 60% boost, you'd plan for $160,000.
Creating Multiple Scenarios
Smart forecasting isn't about predicting one outcome—it's about preparing for multiple possibilities:
- Base scenario: Maintain current spend levels and efficiency
- Growth scenario: Increase spend by 50%, CAC increases by 20%
- Aggressive scenario: Double spend, CAC increases by 30%

Run each scenario through your model to see the impact on revenue, contribution margin, and cash flow.
Reading Your Forecast
Once your model is complete, you can see month-by-month expectations for:
- Number of new customers acquired
- New customer revenue
- Returning customer revenue
- Contribution margin at all three levels
- EBITDA
- Cash position
You'll also be able to derive your target MER (Marketing Efficiency Ratio) and AMER (Adjusted Marketing Efficiency Ratio) from this data.
The Real Value: Measurement Against Reality
Here's the truth: your forecast will be wrong. We can guarantee it won't be 100% accurate.
But that's not the point.
The value comes from setting a reasonable expectation and then measuring your actual performance against it throughout the year.
Did you expect to acquire 830 customers in July at a $120 CAC? Where did you actually land? If you're consistently missing your forecast, that tells you something important about your assumptions or execution.
When to Update Your Forecast
We typically run comprehensive forecasts at year-end for the upcoming year. But you shouldn't treat it as a "set it and forget it" exercise.
Update your forecast when:
- Your margin profile changes significantly
- You're launching a new product requiring additional media investment
- You're running a major marketing experiment with dedicated budget
- You achieve significant supply chain savings that improve margins
- Actual performance deviates significantly from forecast (indicating your assumptions need adjustment)
The Bottom Line
This forecasting framework helps you:
- Set realistic revenue expectations
- Plan media budgets intelligently
- Optimize spend allocation across the calendar year
- Measure marketing efficiency accurately
- Avoid the trap of "scaling" yourself into bankruptcy
Most importantly, it ensures your paid media team isn't just optimizing for attributed ROAS while your bank account dwindles. They're optimizing for actual business profitability.
If your agency is only reporting Meta ROAS and attributed revenue without tying it to your actual financial performance, you're flying blind.
The brands that win in DTC aren't just the ones with the best creative or the lowest CAC—they're the ones who understand their unit economics, forecast responsibly, and measure relentlessly against those forecasts.
Want help building a forecast for your DTC brand? We work with brands to develop comprehensive financial models that tie marketing performance to actual profitability. Reach out if you'd like to discuss your specific situation.
Check out our other articles.


Get started today.
We only work with a handful of clients per year. If you're interested, book a discovery with our founder to see if this is a good fit.
What we do
Grow & scale your paid media program with a boutique team of eCommerce advertising pros.
Case studies
See what we've done for other brands and how we can help you. Read their stories.