Can you measure SKU-level CAC & contribution margin?

One of the most challenging yet valuable analyses you can run for your DTC brand is measuring customer acquisition cost (CAC) and contribution margin on a product-by-product basis. While this process is labor-intensive and imperfect, it often reveals game-changing insights about where your ad dollars are truly performing.
Why This Analysis Matters
Most brands look at their overall ROAS and think they understand their paid acquisition performance. But when you dig into SKU-level data, you might discover that your "hero product" is actually bleeding money while an overlooked product has been your most profitable acquisition tool all along.
The Reality Check: This Isn't Perfect
Before we dive in, let's acknowledge the limitations. This methodology has inherent imperfections:
- New customers often purchase multiple products in a single order
- Attribution becomes messy when ads feature multiple products
- Data allocation requires manual decisions and assumptions
However, the directional insights you'll gain make this exercise absolutely worth the effort.
Defining Our Terms
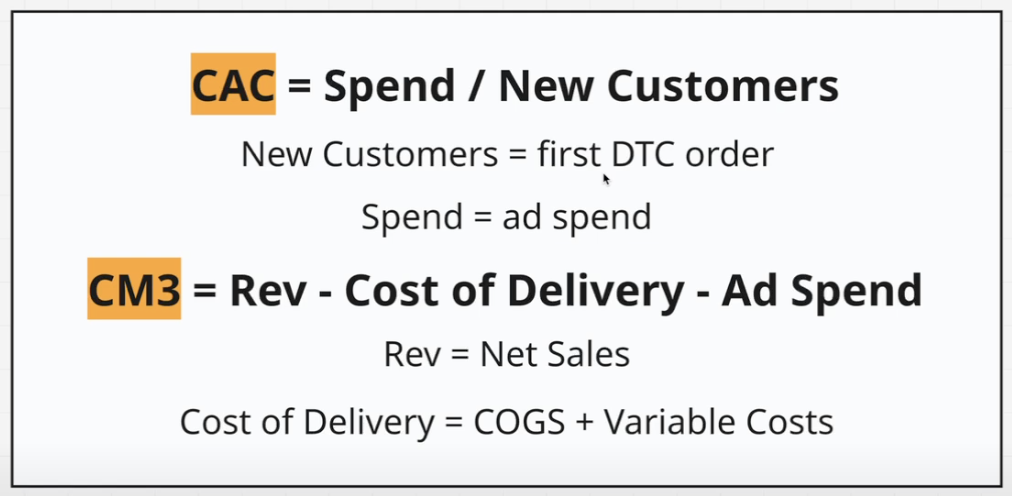
Customer Acquisition Cost (CAC): Digital ad spend divided by new DTC customers. We're focusing purely on new customer acquisition through your owned channels—no retail, wholesale, or B2B sales.
Contribution Margin 3: Net sales minus full cost of delivery minus the digital ad spend. This is what you have left to cover your operating expenses and generate profit.
The Data Collection Process
This analysis requires pulling data from multiple sources and combining them into one comprehensive report. You'll need both revenue-side and cost-side data.

Revenue Side Data
You need to collect the following metrics, broken down by individual product:
- New customer net sales
- New customer contribution margin 1 and 2
- Total number of new customers
- Number of orders containing each product
The key is getting this data at the product level, not as aggregated totals. If you're using a tool like Klar, you can filter their revenue flex table to show only new customers, then export this data to Excel or Google Sheets.
Pro tip: You'll likely need to consolidate variants. If you have a women's long sleeve in multiple sizes and colors, consolidate these into a single "women's long sleeve" line item since you won't be able to get spend data at the variant level.

Cost Side Data
This is where strong naming conventions become crucial. Without them, this analysis becomes nearly impossible.
Social Ads (Meta, TikTok, etc.)
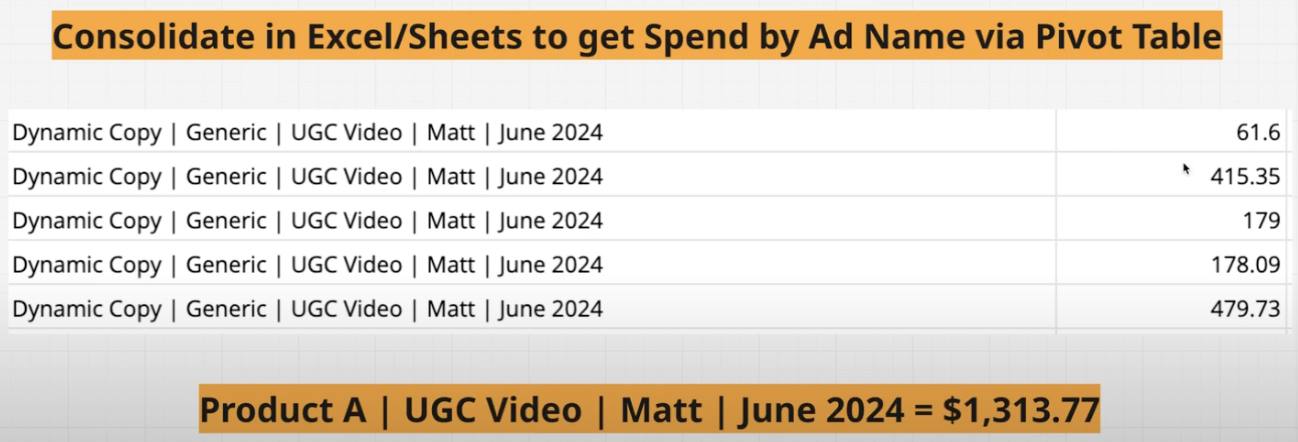
Every ad should include the featured product name in the ad naming convention. Export spend by ad within your defined date range, then use pivot tables to consolidate spend by product. You'll have the same ad running across different ad sets and campaigns—consolidate these into single line items per product.
Google Ads
Google requires a three-pronged approach:
- Product Listing Ads: Go to Campaigns > Products to get spend by product from both Performance Max and standard Shopping campaigns
- Non-Branded Keywords: Assign keyword spend to relevant products (e.g., all "sweater" keywords go to your sweater products)
- YouTube Ads: Like social ads, this relies on naming conventions to identify which product is featured in each video

Putting It All Together
Once you've collected all this data, combine it into a comprehensive analysis. Here's what you're looking for:

Key Metrics to Calculate
- SKU-Specific Acquisition Cost: Total product spend divided by number of units in new customer orders
- Contribution Margin 3: CM2 minus allocated ad spend for that product
- Return on Ad Spend (ROAS): Revenue divided by spend
- Contribution Margin ROAS: Contribution margin divided by spend

What You Might Discover
Here are some common revelations from this analysis:
The Underperforming Hero Product
You might find that your hero product, while driving significant revenue, is consuming a disproportionate share of your ad budget. In one example, a brand was spending 86% of their budget on Product A, but it only accounted for 70% of new customer contribution margin.
The Hidden Winner
Often, you'll discover a product with significantly lower acquisition costs that's been severely underutilized. These products might have CACs one-third of your hero product while driving substantial contribution margin.
The Degrading Asset
Some products show strong historical performance but have become unprofitable over time. You might see a product that had healthy ROAS over 12 months but is now generating negative returns in recent months.
Action Items From Your Analysis
Armed with this data, you can:
- Reallocate spend from underperforming to high-performing products
- Set CAC targets for new product launches based on required profitability thresholds
- Identify products to discontinue advertising entirely if they're consistently unprofitable
- Optimize inventory planning by investing more in your profitable acquisition tools
The Bottom Line
This analysis answers a critical question: Are your ad dollars going to the products that actually drive profitable new customer acquisition?
While the methodology isn't perfect, the directional insights are invaluable. You might discover you've been hemorrhaging money on your supposed best-seller while ignoring a goldmine sitting in your product catalog.
The legwork is significant, but finding inefficient ad spend and missed opportunities makes it absolutely worth the effort. Your future self (and your P&L) will thank you.
Want help running this analysis for your brand? We've helped dozens of DTC companies uncover hidden insights in their product-level performance. Send us a message to get started.
Check out our other articles.


Get started today.
We only work with a handful of clients per year. If you're interested, book a discovery with our founder to see if this is a good fit.
What we do
Grow & scale your paid media program with a boutique team of eCommerce advertising pros.
Case studies
See what we've done for other brands and how we can help you. Read their stories.